
Python libraries: Pandas | Requests | BeautifulSoup | Plotly
Tech used: Jupyter Lab and IBM Watson Studio
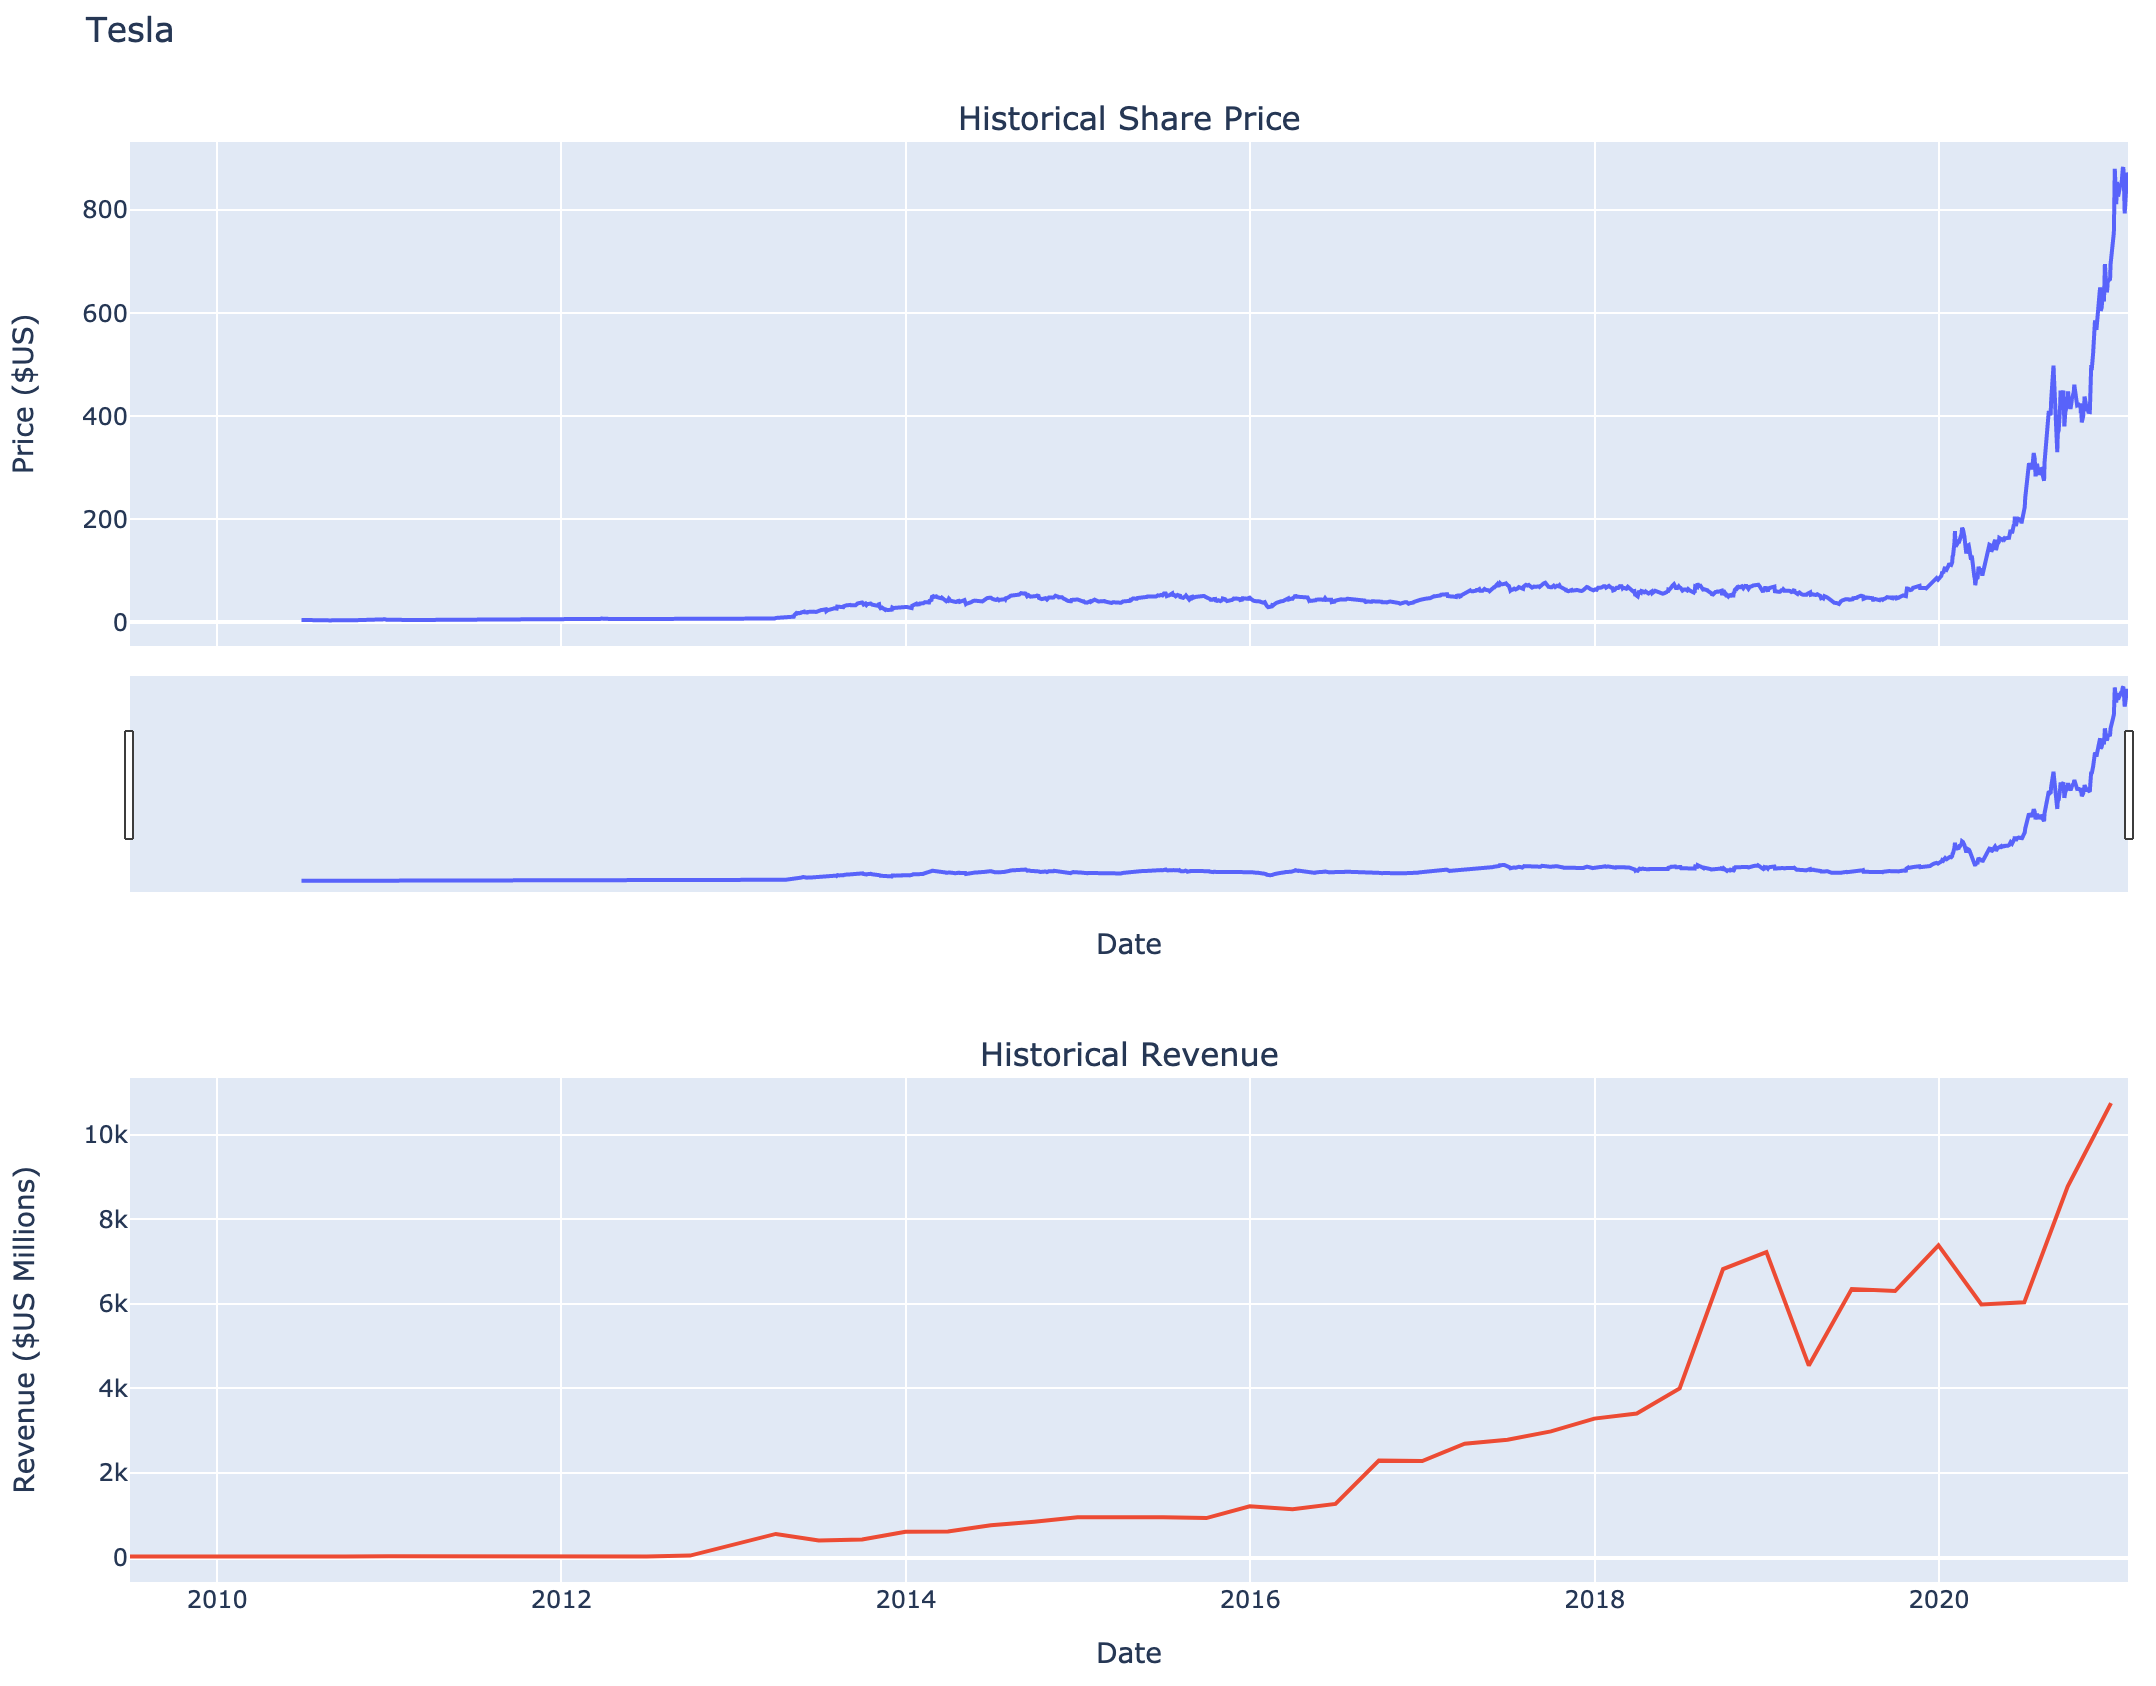
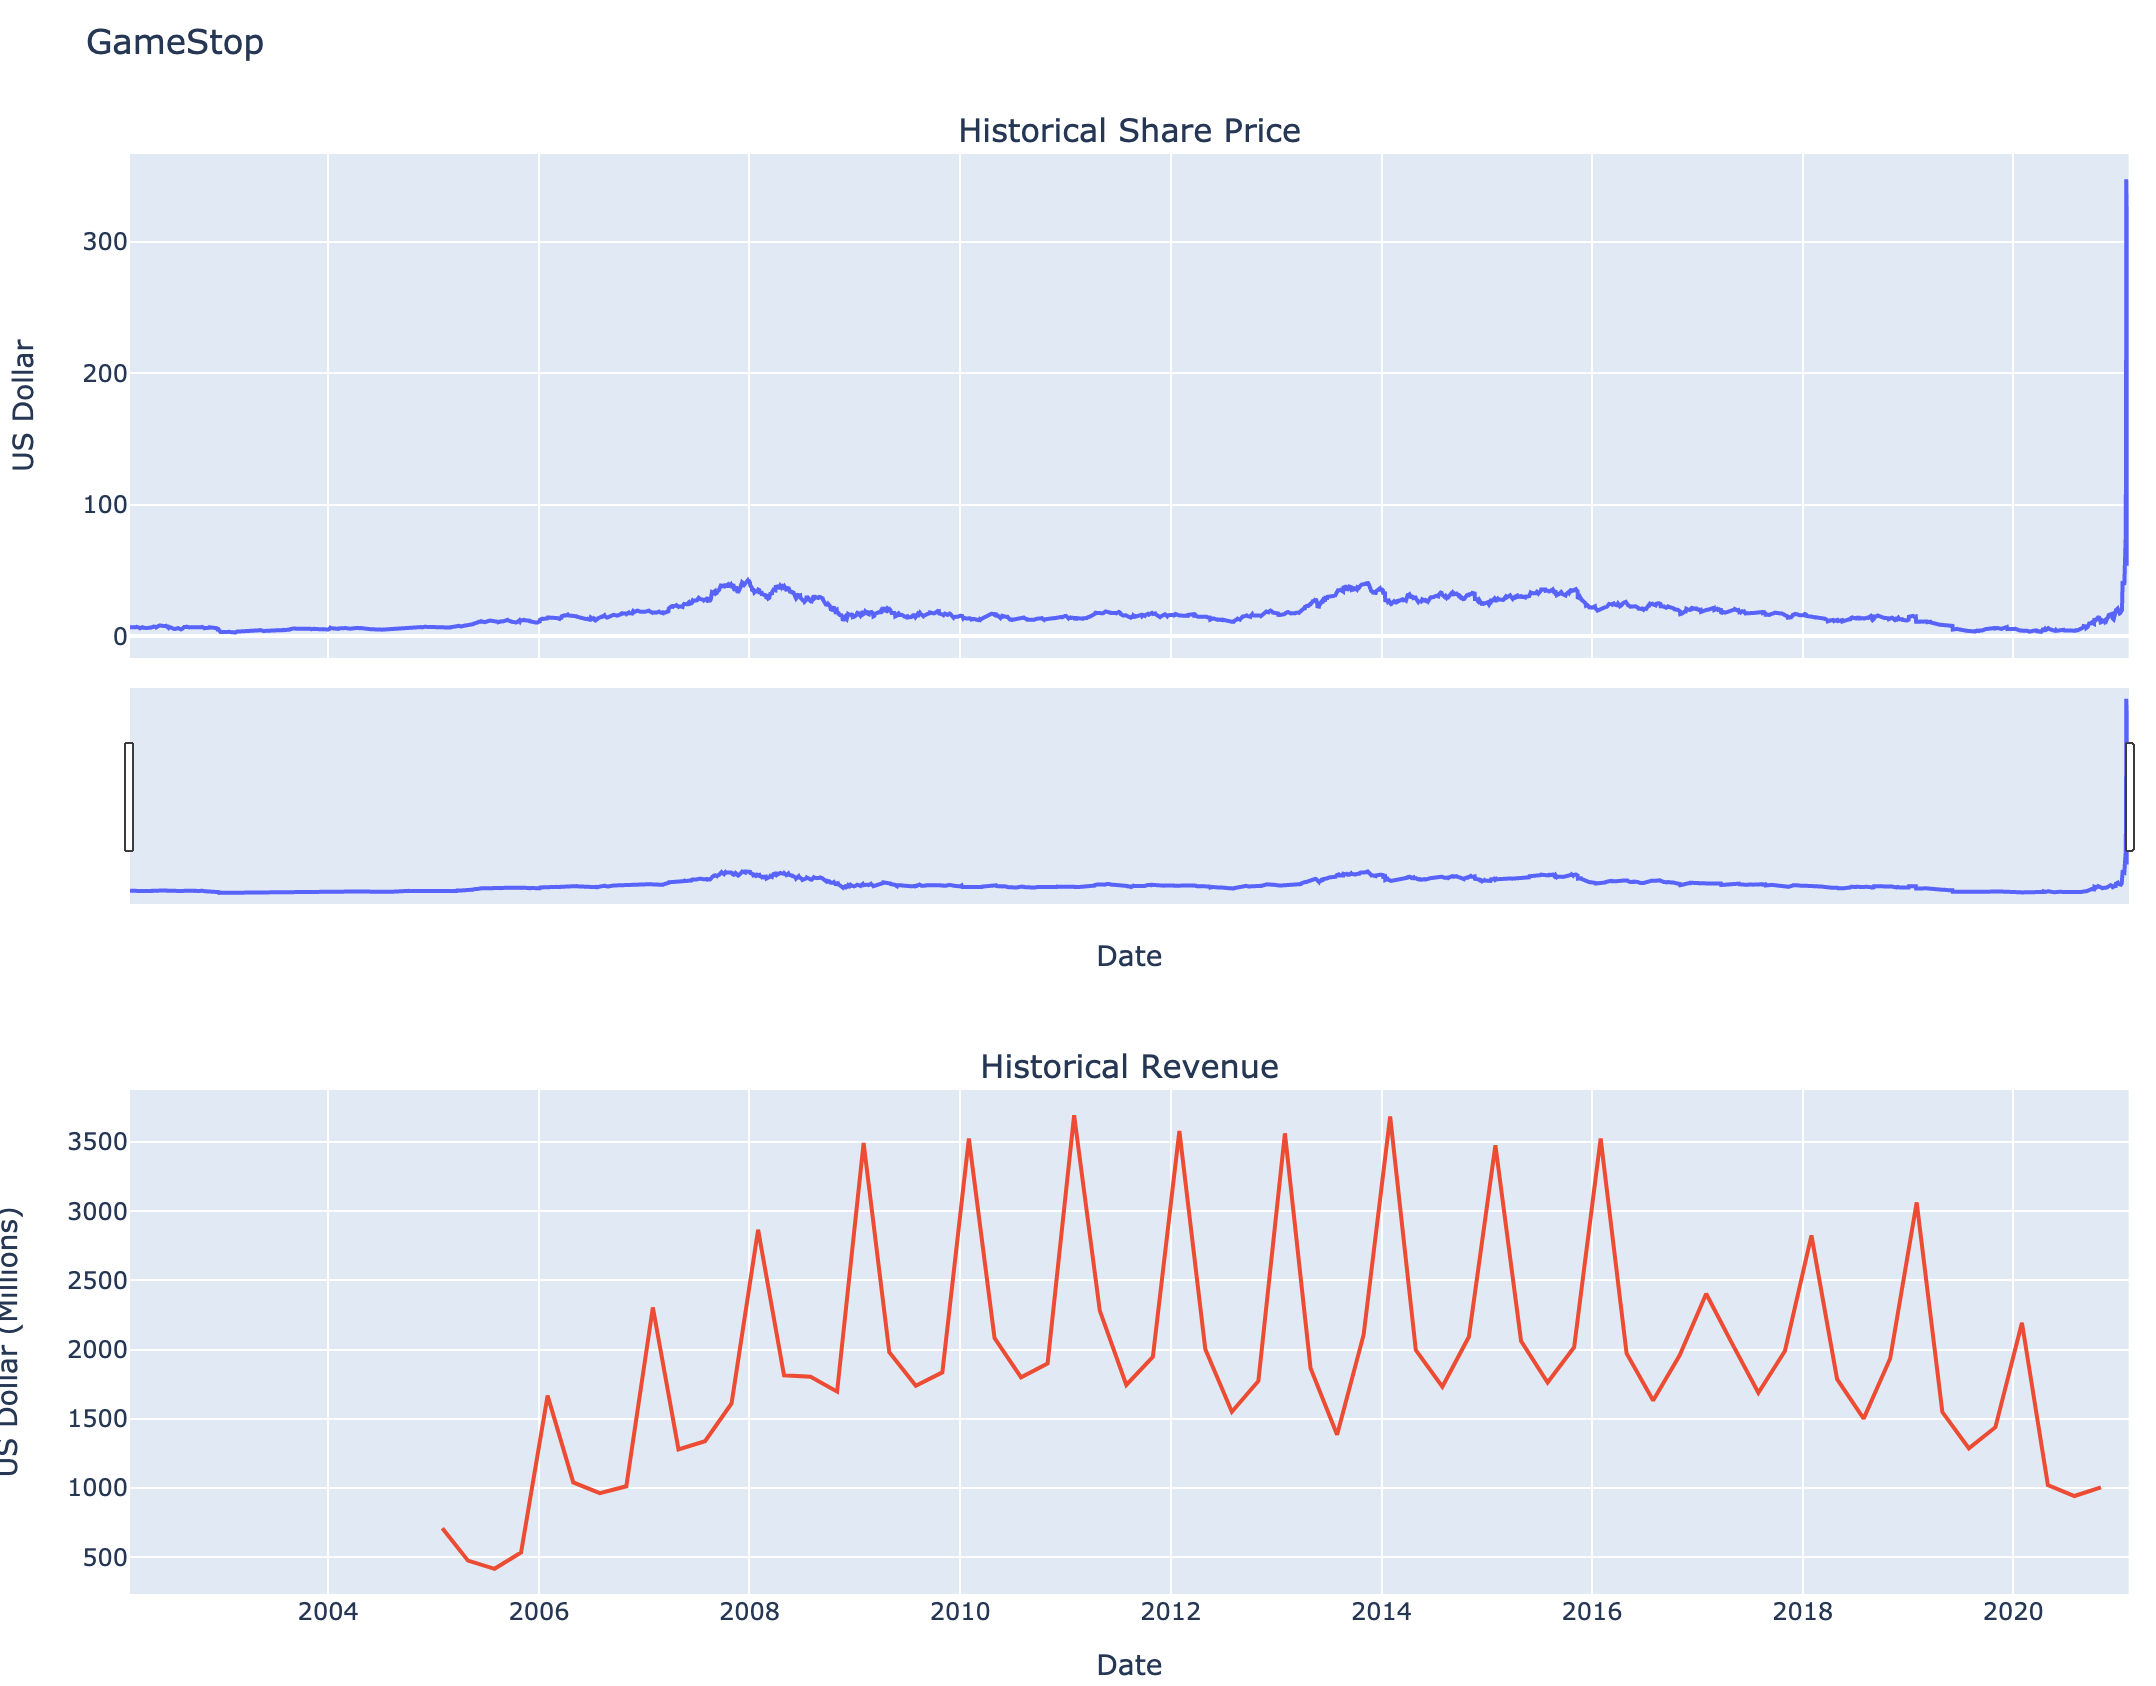
I analyzed revenue data for Tesla and GameStop and built a dashboard to compare the price of the stock vs the revenue. This Analysis is the final Capstone Project of the Python Project course from my IBM Data Science Certificate. Check out the certificate right here: IBM Certificate.
The project was performed with the help of:
- yfinance data from yfinance API
- I applied various Data Analysis techniques from Data Extraction (API & Webscraping) to Data Analysis (Processing & Dashboard).
- Tesla and GameStop graphs clearly described the recent upward trends of these stocks.